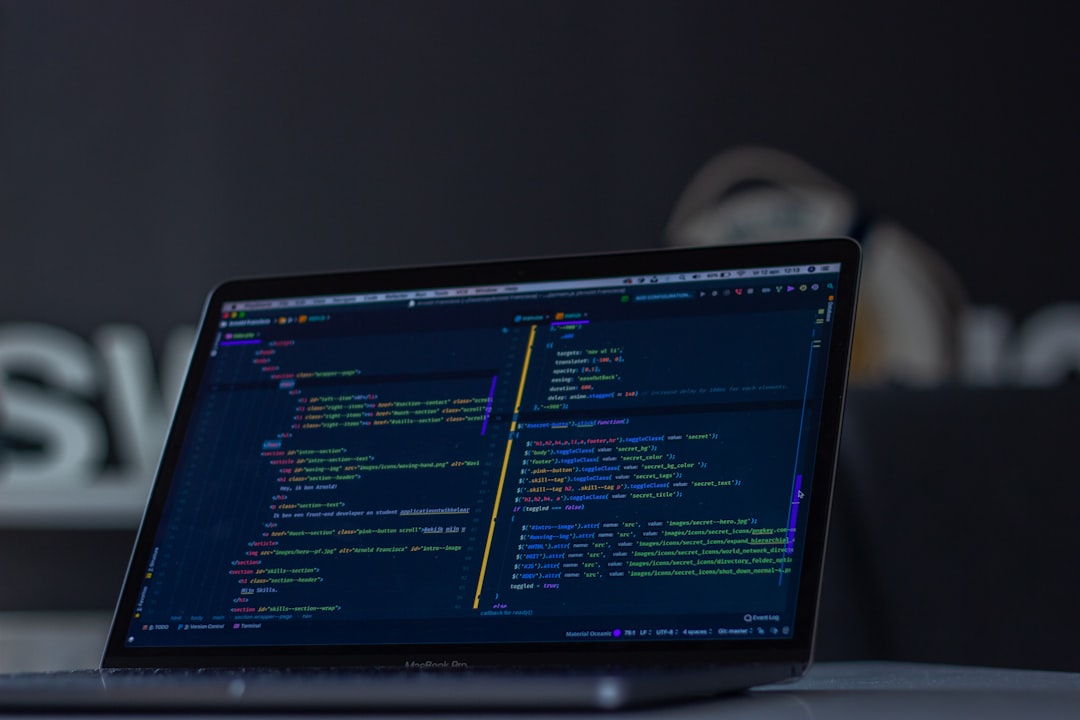
The Shift: Observability Meets the IDE
For most of the last decade, an engineer investigating a production incident lived in three places at once: the IDE, the observability tool, and a chat window for the incident bridge. Context-switching was the dominant cost. Every jump between Cursor and Datadog to find the error rate on a specific endpoint, and then back to the code to look at the function that owns it, cost seconds of focus — and by the end of a thirty-minute triage, the accumulated cost was substantial.
Model Context Protocol (MCP) changed the shape of that workflow. By Q1 2026, most major observability vendors had shipped MCP servers that expose their telemetry — logs, metrics, traces, incidents, deployments — as tool calls an agent can invoke directly. The effect is that the IDE itself can now answer observability questions without a context switch.
Datadog’s MCP server went GA in March 2026. Honeycomb expanded its MCP integration to cover Cursor, Claude Code, the AWS DevOps Agent, and several other clients. Grafana shipped its MCP server in early 2026 covering Prometheus, Loki, and Tempo. Sentry launched an MCP server for error tracking and release health. The MCP registry as of April 2026 has over 6,400 servers, and observability is one of the fastest-growing categories.
This post is a practical 2026 guide to wiring observability MCP servers into Cursor, Claude Code, and Codex — what each one gives you, how to configure them securely, and what patterns work in production.
What “Observability via MCP” Actually Looks Like
The simplest way to describe it is with a workflow. An engineer in Cursor is working on the checkout service. They ask: “What is the p99 latency on the checkout endpoint over the past hour, and is it tied to any specific error code?”
Without MCP, they would open Datadog, navigate to the APM trace view, filter by service and endpoint, switch to the log explorer, filter by status code, correlate timestamps, and bring the findings back to the IDE.
With the Datadog MCP server configured, Cursor issues a tool call to query_traces with the service, endpoint, and time range, then a tool call to query_logs filtered by the trace IDs of the slow requests. The model returns: “p99 is 1,840ms over the past hour (baseline 320ms). The slow traces are almost all tagged with error=payment_gateway_timeout. The function PaymentGateway#capture in app/services/payment_gateway.rb is the common path.” The engineer clicks through directly to the line.
This is a real, day-one workflow. The 2026 productivity delta from it is meaningful — industry surveys put engineer self-reported time saved on incident triage at 30–50% when MCP observability is wired in.
The Core MCP Servers for Observability
Here are the production-ready MCP servers worth configuring first, grouped by what they expose.
Datadog MCP Server
Exposes traces, logs, metrics, monitors, incidents, and deployments. Read-only by default; creating monitors or posting incident comments requires a scope that is disabled unless explicitly enabled.
Install for Claude Code:
claude mcp add datadog \
  --env DD_API_KEY=$DD_API_KEY \
  --env DD_APP_KEY=$DD_APP_KEY \
  --env DD_SITE=datadoghq.com
The most useful tool calls in practice: query_metrics, query_logs, query_traces, list_incidents, get_incident_timeline. The search_service_catalog call is underrated for the “who owns this service” question.
Honeycomb MCP Server
Strong if you’re already on Honeycomb’s high-cardinality tracing. Exposes queries, boards, triggers, SLOs, and derived columns. The standout capability: an agent can construct a BubbleUp query to identify which dimension is responsible for an anomaly, not just observe the anomaly.
Install for Cursor: add the MCP server via the Cursor settings UI with your Honeycomb API key and environment slug.
Grafana MCP Server
Covers Prometheus, Loki, and Tempo in a single server. This is the right choice if your observability stack is open-source. The 2026 release added native support for Grafana Alerting and on-call schedules (via the Grafana OnCall integration).
Install notes: the Grafana MCP server supports both self-hosted Grafana and Grafana Cloud. For self-hosted, you configure the Grafana URL and an API token. For Grafana Cloud, you use a cloud access policy token scoped to read-only for observability data.
Sentry MCP Server
Best in class for error tracking. Exposes issues, events, releases, and performance data. The get_issue_with_stack_trace tool returns both the error details and the relevant source context — which lets the model propose fixes without needing a separate code lookup.
Kubernetes MCP Server (containers/kubernetes-mcp-server)
Not strictly observability, but essential for cluster-level investigation. Exposes pod status, logs, events, resource metrics. Read-only by default; apply/delete operations are opt-in and should be gated by policy for any production cluster.
Cloud Provider MCP Servers
AWS, GCP, and Azure each have official or community MCP servers exposing their native monitoring surfaces — CloudWatch, Cloud Monitoring, Azure Monitor. Useful for teams whose primary telemetry is still the cloud provider rather than a SaaS vendor. Worth noting: these typically require IAM/service account credentials scoped carefully, because a misconfigured MCP server can become a lateral movement path.
See the IAN team run on your cloud. We connect to your AWS account via a scoped read-only role, run the Observe-tier agents, and leave you with a concrete audit report — cost waste, security exposure, compliance gaps, and a labor-offset estimate. You keep the findings regardless of next steps. Get a free infrastructure audit →
Security Model: Treat MCP Servers Like Production Services
The biggest implementation mistake teams make in 2026 is treating an MCP server like a local dev tool. It is not. An MCP server with a Datadog app key or a Kubernetes kubeconfig is as sensitive as any production API client.
Four rules that have held up in production deployments:
Least-privilege credentials per agent. The Datadog app key used by your Claude Code MCP should be a read-only key scoped to the services you’re actively debugging, not a full admin key. The Kubernetes service account should be read-only for pods, logs, and events, with no ability to exec, port-forward, or modify resources unless explicitly needed.
No long-lived credentials in IDE config. Use short-lived tokens where possible — Grafana Cloud access policies with 24-hour TTL, AWS SSO-minted credentials refreshed on login, Honeycomb per-environment keys scoped to the engineer. Store them in the OS keychain, not in .mcp.json in a dotfile repo.
Audit the tool calls. The MCP client (Cursor, Claude Code, Codex) logs every tool call. Ship those logs to the same place you ship your other audit logs. If someone’s agent pulled the last hour of production logs at 2am, that should be visible and reviewable.
Block write operations by default. Every observability MCP server has some kind of write capability — muting alerts, acknowledging incidents, creating monitors. These should be disabled for individual engineers’ clients. Write operations, if automated, should happen through a dedicated service (with its own audit trail) that a human explicitly invokes, not through an engineer’s personal MCP config.
Three Patterns That Work in Production
Pattern 1: The Debugging Assistant
The engineer asks natural-language questions about production while reading the code. The agent combines MCP calls across services: Datadog for metrics/traces, Sentry for errors, Kubernetes for pod status. The engineer gets a single narrative answer with links to each underlying source.
This works because the model can correlate across data sources in a way that a human switching between five tabs cannot. It is the best single reason to adopt MCP observability.
Pattern 2: The Incident Responder Primer
At the start of an incident, the on-call engineer asks the agent to “summarize what’s happened in the last 15 minutes on the payments service.” The agent queries recent deployments, error rate trends, slow trace samples, and recent alerts, and produces a briefing. The engineer reads the briefing instead of assembling it from scratch.
Critical: this pattern does not auto-remediate. The human is still the responder. The agent is just removing the five-minute context-assembly phase.
Pattern 3: The Pre-Merge Reality Check
Before merging a PR that touches a critical code path, the agent is asked to look up the production error rate, latency, and traffic on that code path, and flag whether the change has a likely production impact. For rare-but-critical code paths — failure modes, retry logic, rate-limit handling — this catches changes that “look fine” but would cause production incidents under stress.
Anti-Pattern: The Autonomous Firefighter
Several teams tried in Q1 2026 to give coding agents write access to observability tools and autonomy to mute alerts, silence monitors, or re-trigger deployments during incidents. The results were consistently bad. Agents silenced real alerts. Agents re-triggered failed deploys during active outages, amplifying the incident. Agents created monitors that duplicated existing ones, adding noise.
The current industry consensus is that MCP observability should be read-heavy, write-restricted, and always have a human in the loop for any change that affects the incident response path.
How IAN Uses MCP Observability
IAN consumes MCP observability data as part of its own audit workflow. When IAN proposes a fix, it queries the relevant observability MCP servers for the current production behavior of the affected code path — error rate, latency, traffic — and includes that data in the PR description. This lets the human reviewer see not just “here is the proposed fix” but “here is what the affected code is doing in production right now.”
For customers using Datadog, Honeycomb, Grafana, or Sentry, this means IAN PRs come with live production context. The reviewer does not need to switch tools to understand whether the fix matters.
Wire One In This Week
If you are running any AI coding agent (Cursor, Claude Code, Codex, or an internal one), pick your primary observability tool and wire up its MCP server this week. Configure read-only credentials, restrict write operations, and ship the tool-call audit logs to your standard audit destination. By next week, your incident triage will be measurably faster, and you will wonder how you worked without it.
Next step: talk to the team
30 minutes. We'll look at your cloud together and scope what we'd take off your plate — see pricing.